Your Codebase Is Bleeding Hours: How Poor Debugging Practices Are Quietly Draining Your Team
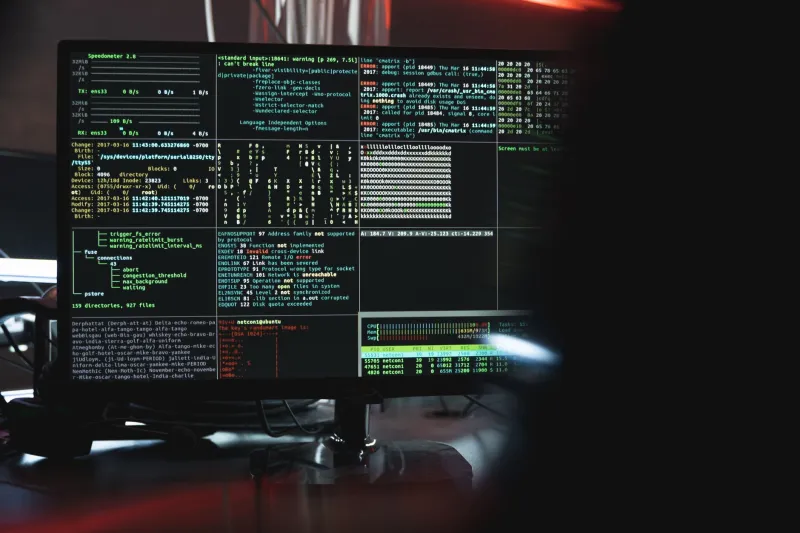
Here's a scenario that probably sounds familiar: a bug surfaces in production on a Tuesday afternoon. Two engineers drop everything to investigate. They dig through logs — or rather, they dig through whatever logs happen to exist — and spend the next three hours piecing together what went wrong from incomplete breadcrumbs, Slack messages, and gut instinct. By Thursday, they've fixed the issue. But nobody's asking the more uncomfortable question: why did it take that long in the first place?
This is what we call the debugging tax. And most teams are paying it every single day without realizing it.
Research from Stripe's developer productivity studies and follow-up surveys across mid-to-large engineering orgs consistently put the number somewhere between 35% and 45% of active development time spent on debugging — not shipping features, not improving architecture, not mentoring junior devs. Just debugging. A significant chunk of that time isn't even spent fixing bugs. It's spent figuring out what broke and where.
That's not a bug problem. That's an observability problem.
What "Observability" Actually Means (And What It Doesn't)
Observability has become one of those words that gets thrown around in architecture meetings until it loses all meaning. Let's keep it simple: observability is your team's ability to understand what's happening inside a system by looking at what it outputs. Logs, metrics, traces — the holy trinity.
What observability is not is a vendor's SaaS platform that costs $80K a year. That framing has scared off a lot of smaller teams who assume they can't afford to get serious about this stuff. The truth is, the biggest wins in observability come from discipline and structure, not spend.
The expensive tools are nice. But bad logging practices will make even the most sophisticated monitoring platform useless.
The Logging Problem Nobody Wants to Admit
Most codebases have logs. Very few have useful logs.
Here's what bad logging looks like in practice: console.log('here'), console.log('error occurred'), log statements that capture stack traces but no request context, logs that fire in development but get stripped in production, and — the classic — logs that exist in abundance but are never structured in a way that's actually queryable.
Structured logging is the single highest-ROI change most teams can make right now, today, without buying anything. Instead of logging a plain string, you log a JSON object with consistent fields: timestamp, severity, service name, correlation ID, user context (anonymized), and the actual message. Tools like pino for Node.js, zerolog for Go, or Python's built-in logging module with a JSON formatter make this straightforward.
The payoff? When something breaks at 2am, your on-call engineer can filter logs by a single request ID and reconstruct exactly what happened across every service that request touched. That three-hour debugging session becomes thirty minutes.
Distributed Tracing Without the Sticker Shock
If you're running microservices — or even a handful of interconnected services — distributed tracing is where you get your time back at scale. The concept is simple: every request gets a unique trace ID that follows it through your entire system. Every service that touches that request logs what it did, how long it took, and whether anything went wrong.
The OpenTelemetry project has made this accessible in a way that wasn't possible five years ago. It's vendor-neutral, widely supported, and free. You instrument your services once using the OpenTelemetry SDK, and then you can ship that telemetry data to whatever backend makes sense for your team — Jaeger (open source, self-hosted), Grafana Tempo (also free tier available), or a commercial option if and when you grow into it.
A reasonable implementation path for a team of five to fifteen engineers:
- Week one: Add OpenTelemetry auto-instrumentation to your top two or three most critical services. This is often a few lines of config, not a rewrite.
- Week two: Stand up a local Jaeger instance (Docker makes this trivial) and start visualizing traces in your staging environment.
- Week three: Establish trace ID propagation as a team standard. Every new service gets it from day one.
- Month two: Review your slowest traces. You will find performance problems you didn't know existed.
Error Tracking That Actually Surfaces What Matters
Logs and traces tell you what happened. Error tracking tells you how often it's happening and who it's affecting.
Sentry remains the go-to here for a reason — the free tier is genuinely useful for small teams, and the core feature set (error grouping, stack traces with source maps, release tracking, user impact counts) directly answers the questions that matter most during an incident. GlitchTip is a solid self-hosted alternative if you're privacy-conscious or want to keep data in-house.
The underused feature in most error tracking setups is alerting thresholds. Teams often configure error tracking to alert on every new error, which creates noise that engineers start ignoring. Instead, configure alerts based on error rate — alert when a known error spikes beyond its baseline, or when a new error class appears. That's signal, not noise.
Building a Debugging Playbook Your Team Will Actually Use
Tools are only half the equation. The other half is process — specifically, making sure your team has a shared mental model for how to approach a production issue.
A simple incident playbook doesn't need to be a fifty-page runbook. It needs to answer three questions:
- Where do we look first? (Which dashboards, which log queries, which services are likely culprits based on the symptom?)
- How do we share context? (A dedicated incident Slack channel, a shared doc, a running timeline — pick one and stick to it.)
- How do we capture what we learned? (A lightweight post-mortem template that takes twenty minutes to fill out, not two hours.)
The post-mortem piece is where the compounding returns kick in. Every incident your team investigates is a chance to improve your observability setup so the next similar incident takes half as long. Teams that treat post-mortems as box-checking exercises don't get better. Teams that treat them as product feedback for their own tooling infrastructure get dramatically faster over time.
The ROI Math Is Pretty Straightforward
Let's put some rough numbers on this. If a ten-person engineering team averages $130K in fully-loaded annual cost per engineer, that's $1.3M in annual payroll. If 40% of that time is debugging-related — and even half of that is recoverable through better observability — you're looking at roughly $260K in recoverable capacity per year. That's two engineers worth of output sitting on the table.
Implementing structured logging, basic distributed tracing with OpenTelemetry, and a free-tier error tracking tool costs you maybe two weeks of focused effort across two engineers. The math isn't subtle.
Start Small, But Start Now
You don't need to overhaul everything at once. Pick the one service that causes your team the most pain when it breaks. Add structured logging. Add a trace ID. Hook it up to Sentry. Do a post-mortem on the next incident using that new data.
Then do it again for the next service.
Better observability isn't a project you finish — it's a habit your team builds. And once your engineers experience the difference between debugging with good tooling versus debugging in the dark, you won't have to convince anyone to keep going.